Monitoring & Observability
In Genum, you can't improve what you can't observe. Monitoring gives you full visibility into prompt usage, performance, and system health.
Genum provides two complementary monitoring views:
- FinOps Dashboard for usage and cost visibility
- Execution Logs for detailed, request-level inspection
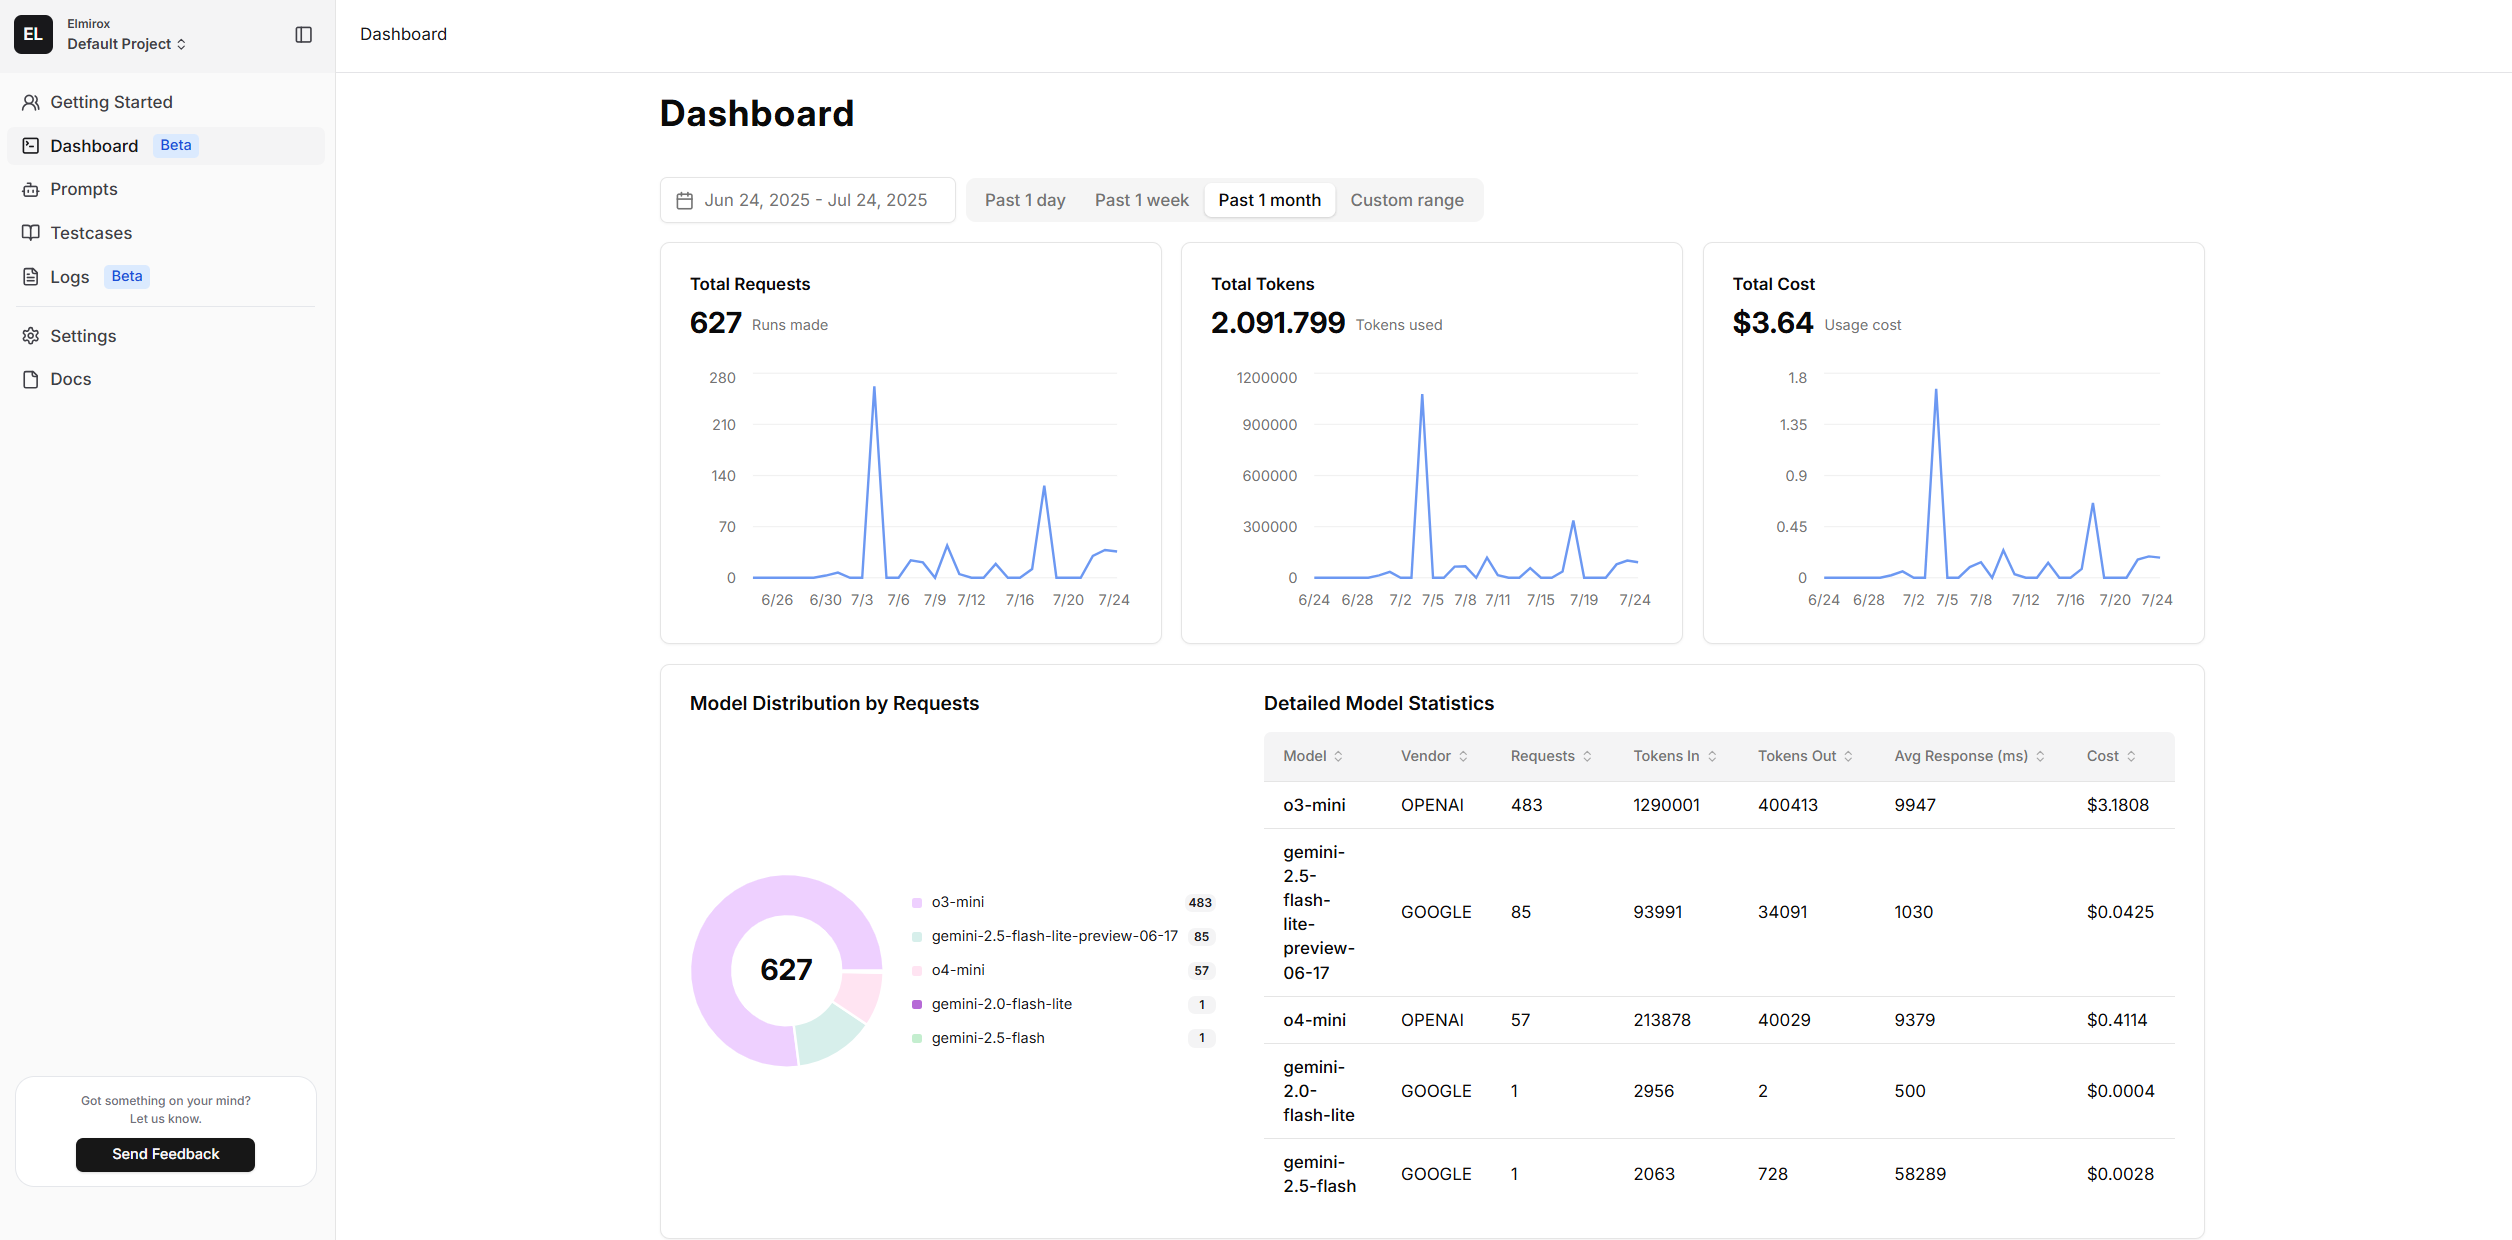
FinOps Dashboard
The Dashboard offers a high-level view across your organization:
- Prompt execution volume
- Token consumption per model
- Total cost breakdown by vendor/model
- Most active users and API keys
- Model usage frequency and load
This is ideal for:
- Identifying high-cost areas
- Tracking API consumption over time
- Reviewing operational efficiency
You can filter Dashboard data by 📅 date ranges.
Execution Logs
Logs provide deep technical visibility into every prompt execution:
- ✅ Input
- ✅ Output
- ✅ Prompt version and ID
- ✅ AI model and configuration (temperature, model, token limits, etc.)
- ✅ Response time
- ❌ Error tracking for failed executions (e.g. model timeout, quota issues)
Where Logs Appear
- Global Logs (left menu → Logs)
- Inside each prompt view (filtered to that prompt only)
Log Filtering
You can filter logs by:
- Date range
- Source (API / UI)
- Status (success, error, etc.)
This helps isolate:
- Problematic executions
- Vendor-specific failures
- High-latency prompts
Monitoring in Genum is built for both operators and developers — to help you track usage, diagnose errors, and optimize performance.
Stay informed. Stay efficient. ✅